Daily routine
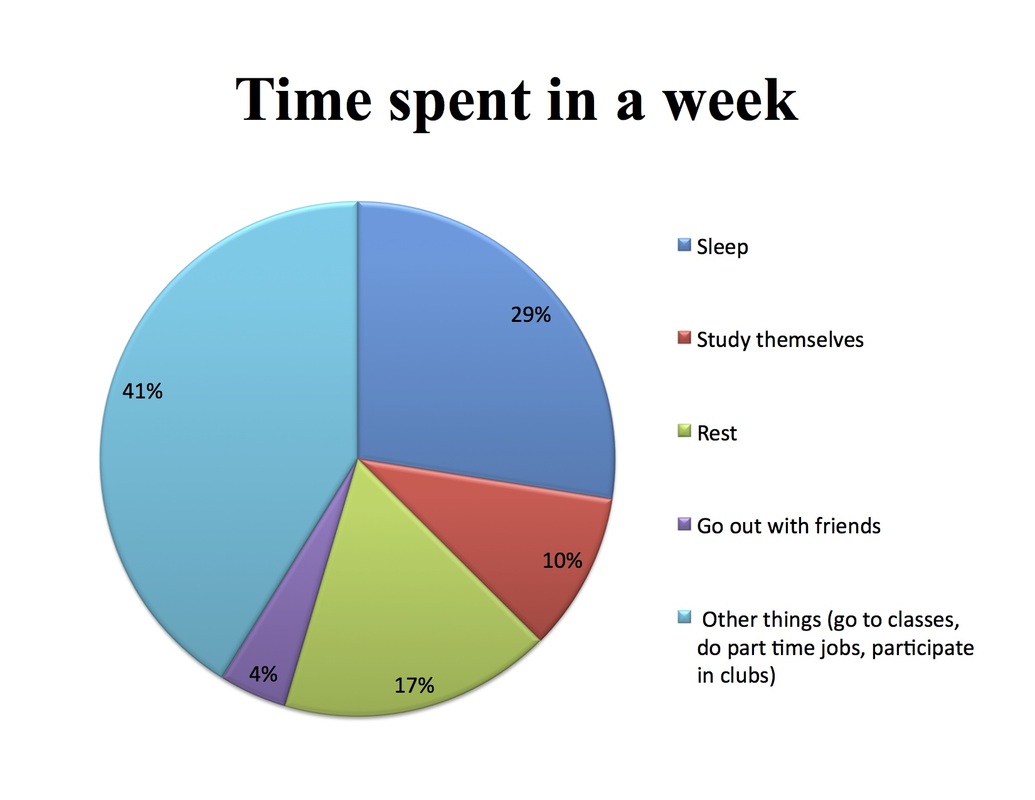
Figure 1.1
We asked 20 freshmen at the university about their daily chores and drew 2 charts to show how they use their time and whether they are satisfied with it or not.
These are the charts we made.
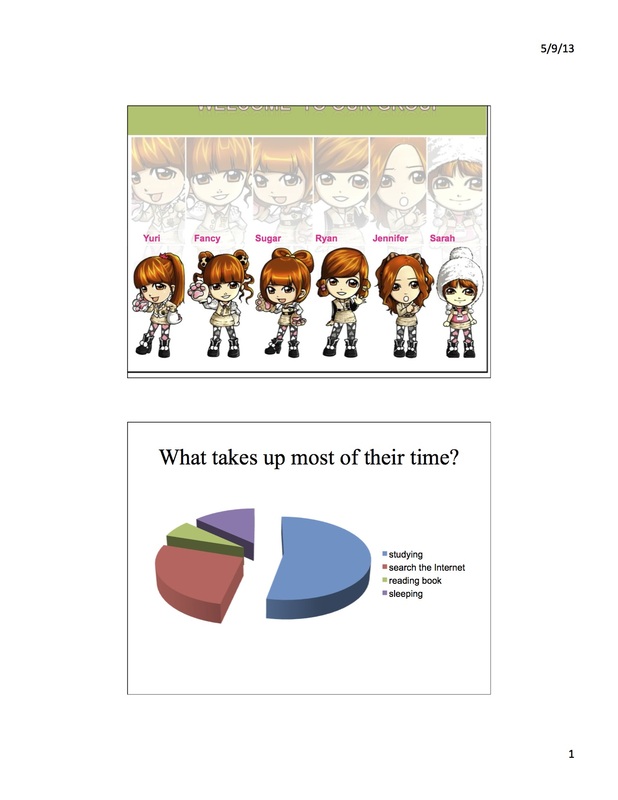
The pie chart (Figure 1.1) shows the proportion of time spent in a week by first year students in Da Nang.
The greatest proportion of daily routine (41%) was on the things such as going to classes, doing part-time jobs, participating in clubs as opposed to only 4% going out with friends. This figure was quite low to about 10% of students study by themselves. Moreover, most students like sleeping as a pastime, which accounts for 28%. The proportion of daily routine was about to 17% in resting.
In summary, the data shows that sleeping and other things like going to classes, doing part-time jobs, participating in clubs was the most time spent in a daily routine.
Attitudes about time
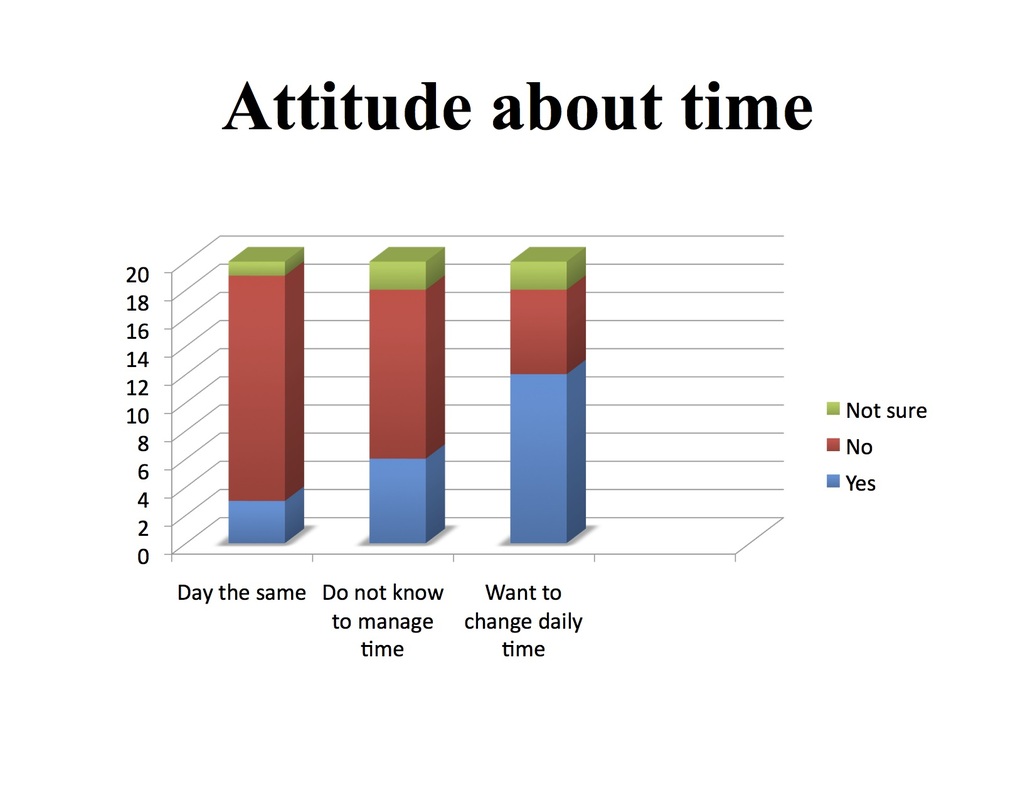
Figure 1.2
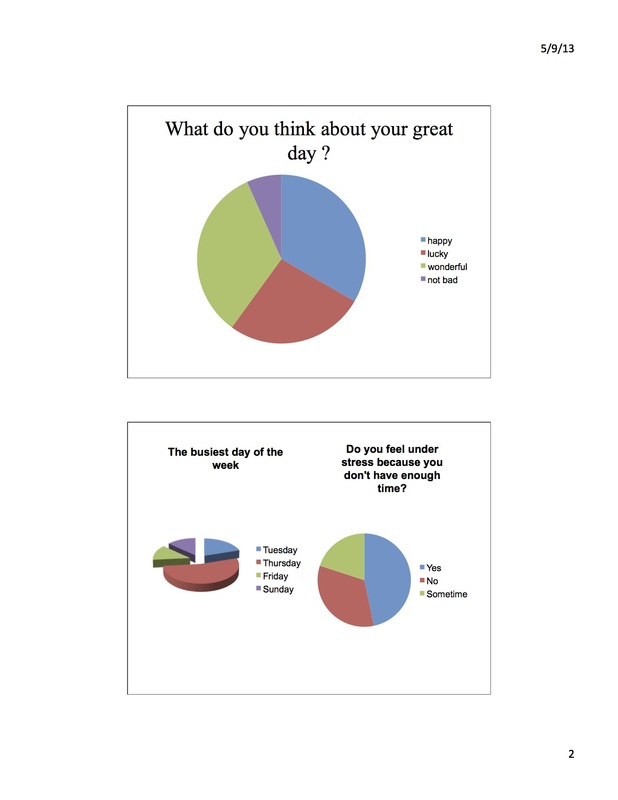
—The chart (Figure 1.2) presents the number of people who think their days are the same; they know how to manage time and want to change their daily routines.
—As can be seen, for the same day the greatest number was “NO” answer ( 18 people) , while there were 3 people who chose “YES." By contrast, the “NOT SURE” answer only was one people of the total. In comparison with the ways to manage time, “NO” answer (12 people) doubled that of “YES” answer (6 people). While the number of people chose “NO” answer was the least with 2 people. If they had a chance, there were 12 people answered “YES” while people chose “NO” and “NOT SURE” were 6 people, 2 people respectively. To sum up, almost everyone we interviewed wanted to have more hours in a day and most do not manage their time logically. Therefore, if there were an opportunity, they would like to change their day.
—As can be seen, for the same day the greatest number was “NO” answer ( 18 people) , while there were 3 people who chose “YES." By contrast, the “NOT SURE” answer only was one people of the total. In comparison with the ways to manage time, “NO” answer (12 people) doubled that of “YES” answer (6 people). While the number of people chose “NO” answer was the least with 2 people. If they had a chance, there were 12 people answered “YES” while people chose “NO” and “NOT SURE” were 6 people, 2 people respectively. To sum up, almost everyone we interviewed wanted to have more hours in a day and most do not manage their time logically. Therefore, if there were an opportunity, they would like to change their day.
Daily activities
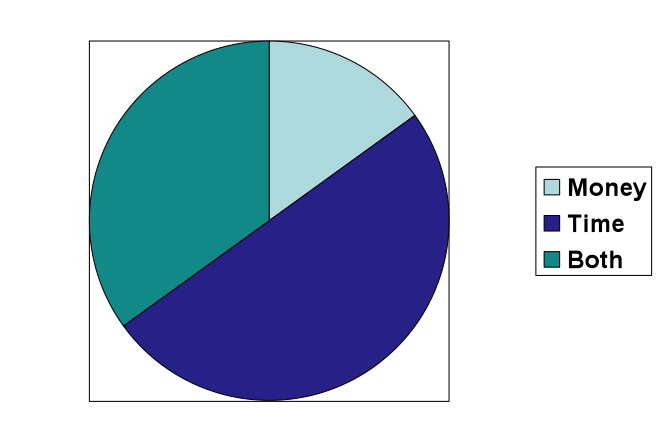
Figure 2.1
- There are more people wake up late in the morning. Just 45% people in this survey say “Yes” when we ask this question. There are many people (85 %) go out at the weekend, watching movies, going to the park, have some fun with friends… Just a few ones feel like staying home, sleeping or watching T.V (15 %).
- 60 % of people say “Yes” when we asking about reading books. They are people wanting to improve their knowledge.
- We are excited about all the people, when
they say “Yes” about being on time.
- Seems like most people can’t manage their time effectively. Just 55% people can manage their time wisely.
- Really, waiting for something or someone doesn’t good. There are 60% people feel uncomfortable when they must wait for something or someone in a long time.
- Some people are
in a hurry, so they think fast food is necessary
for a busy life and work. But some don’t think so. In this survey, they are the
same percentage (50 – 50 %).
- As you see in Figure 2.1, most people appreciate time. They think without time, they can’t do anything complete. Some others say they just think about money. We can’t buy anything if have no money. And the rest like both. It’s so great if we have two important things in our life.
Survey: Please participate!
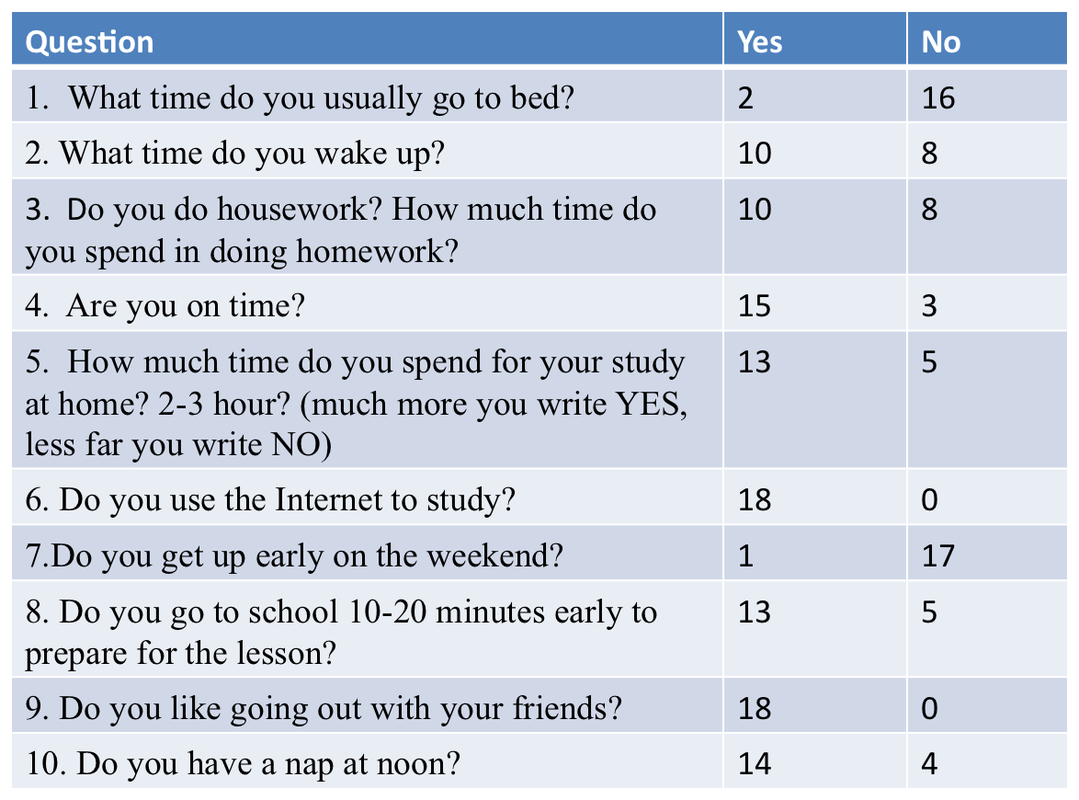
Figure 3.1
We did a survey (Figure 3.1) to investigate the routines of the first-year students of the international department. In the first table, the figures were accounted to show the different routines of going to bed and waking up. The students who go to bed early made up 10 percent. Meanwhile, the proportion of the students who go to bed late was 90 %.
In the second table (Figure 3.2), it shows the rate of the routines of the student included: doing home work, going to school 10-20 minutes early to prepare for lesson, studying at home about 2-3 hours and using internet for studying. The figures were divided into 2 groups of answer: yes and no. the proportions of yes answers were: 55%,71%,72% respectively. Specially, 100% student say ‘’yes’’ when they were asked to use internet for studying. On the other hand, the proportions of ‘’no’’ answer respectively were: 65%,29% and 28%.
In the third table (Figure 3.3), there was a dramatic difference among the proportion of the answers calculated. Firstly, when the students were asked about their punctuality, the yes and no answer were balanced. (50% and 50%). Secondly , only 5% of student says yes for answering the question if they get up early at weekend or not whereas 95 % of them say ‘’no’’ for this question. Fortunately, 100% student likes going out with their friends. For the last question (Figure 3.4), the proportion of the student who have a snap in the noon was just under 80%. And nearly 20% of the students do not have this routine.
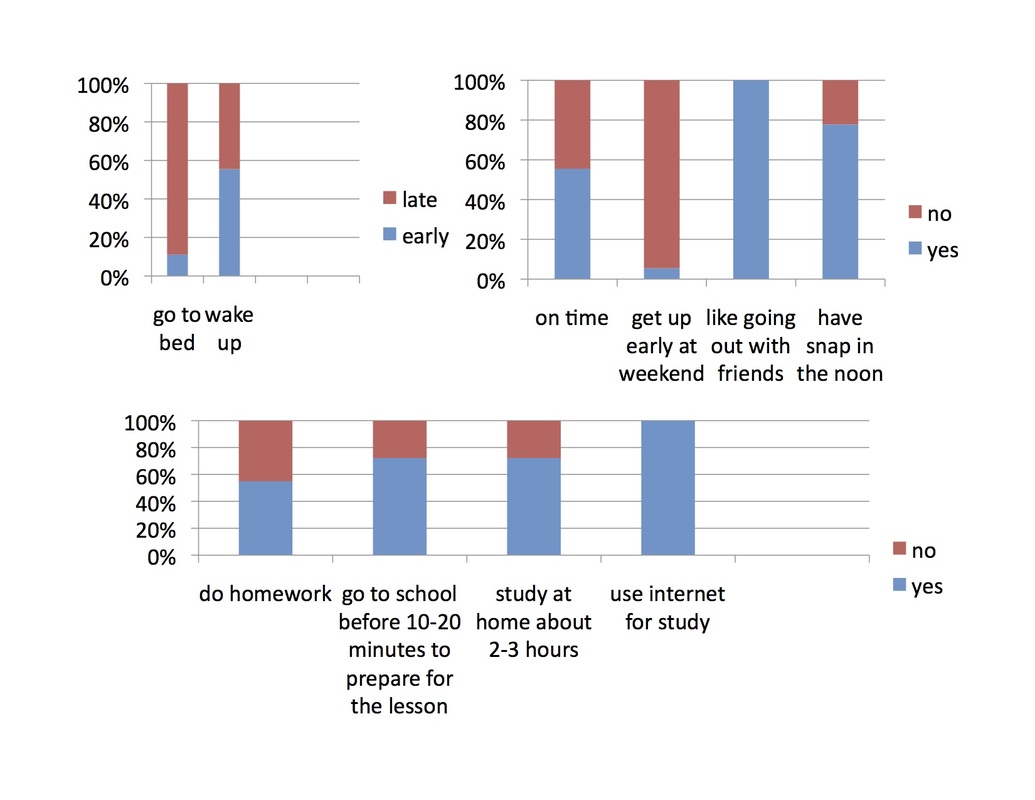
Figures 3.2, 3.3, and 3.4 (bottom, center, rotating counter-clockwise)
|
|
Survey questions

Figure 4.1
•What do you do everyday ?
•What time do you usually go to bed- wake up?
•Do you do housework ? Do you spend your time for family? If yes, how much time do you spend?
•What Is your family's favorite activity to do together?
•How much time do you spend for your study at home?
•Do you use internet? How long do you spend online in a day?
•What do you often do when you're online? ( such as listen to music, watch some movies..so on) •Do you do other activities instead of those?
As you can see in the chart (Figure 4.1), mainly, freshmen usually go to bed at 10p.m and wake up at 6a.m to prepare for going to school, it accounts for 40%.however, there are still some students who go to bed lately. Any student go to bed at 11p.m and get up at 7p.m. The others sleep at 12a.m and get up at 8a.m, it makes up 35% and 25% respectively.
Statistical analysis
Although they are quite busy studying, 75% said that they always spent a lot of time for family. Some activities which they often do with their family are eating together, watching TV, cooking … Studying is pretty important for students. Therefore, instead of study at school, they also spend time to study at home, the number of students who study 3 hours or 4 hours, has a similar percentage. it makes up 25%. the number of freshmen who study 5 hours, makes up the highest percentage, which is 30%. the other students said that they just spent 2 hours for studying at home (see Figure 4.1). Technology nowaday is more developed than that in the past, each of them owns theis private computer to study online ,see some movie, listen to music , search information or read news, there has been 20% who said that they searched the internet just 2 hours a day, the other said that they can't live without surfing the net at least 3 hours (see Figure 4.3). The overall distribution of time spent in daily activities can be seen in Figure 4.4.
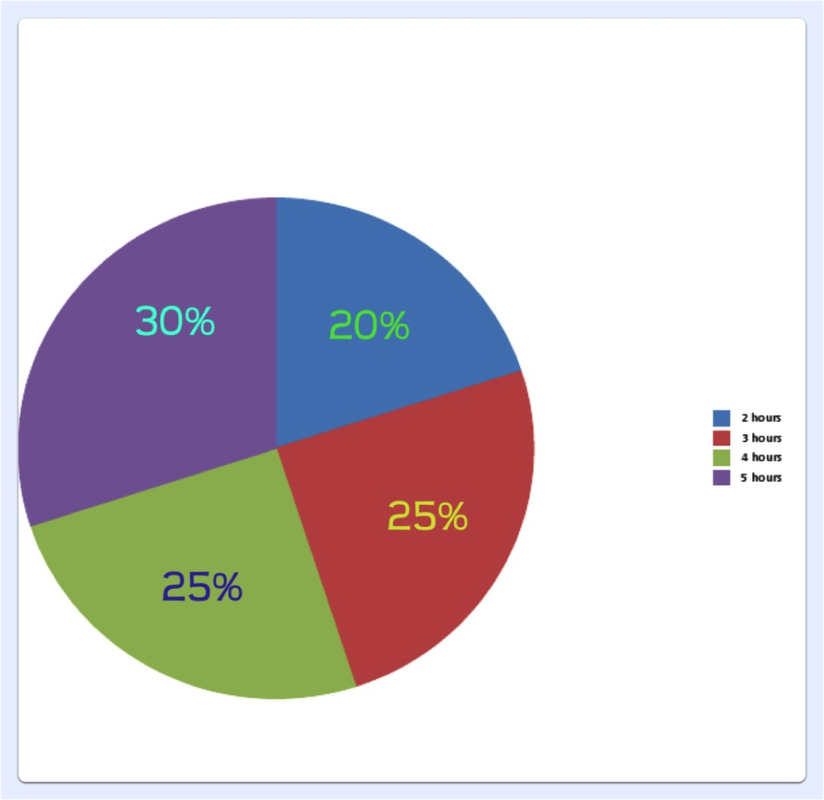
Figure 4.2
|
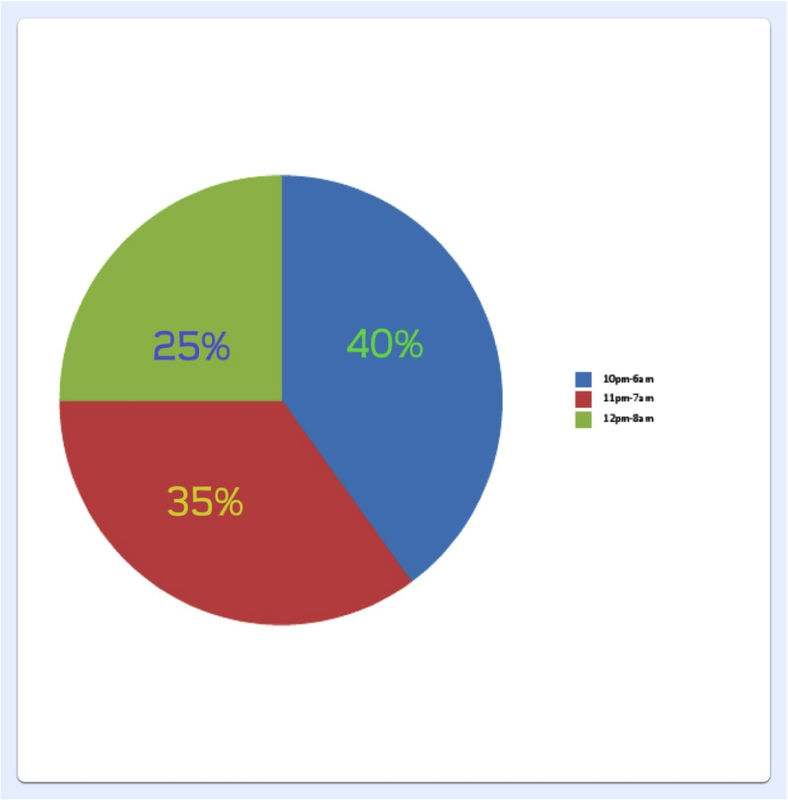
Figure 4.3
|
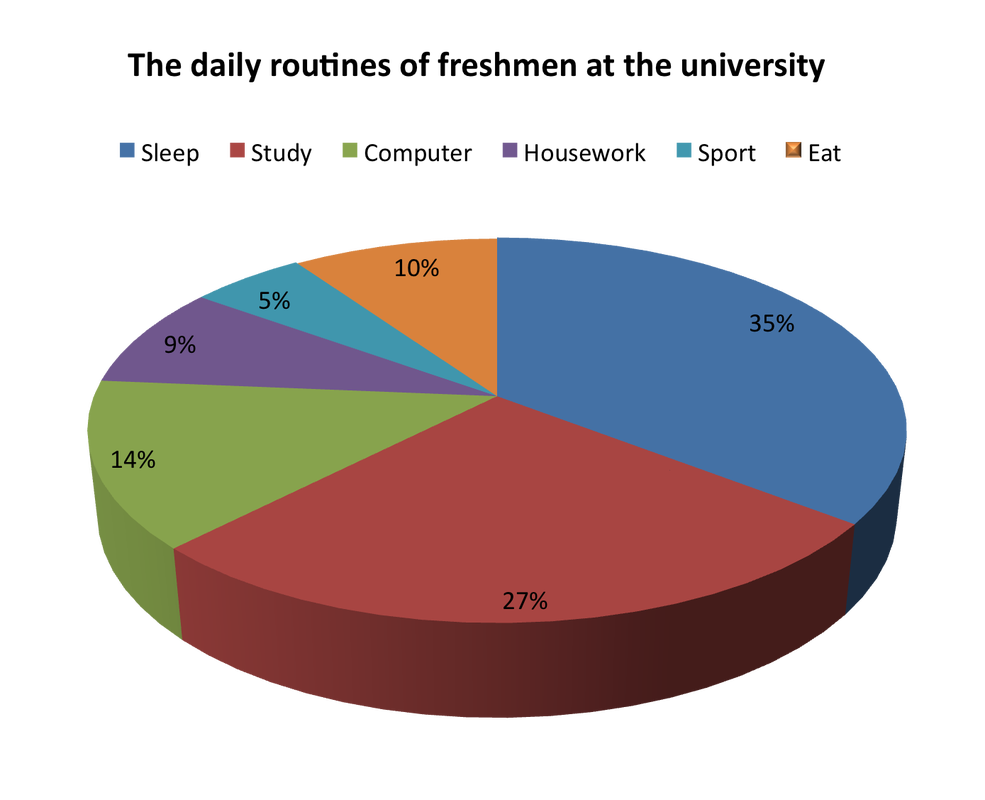
Figure 4.4
|
The Daily Routines of Freshmen at the University
Here is the final statistical compilation of how freshmen spend their time at the university.